Nº 15 · 19 Sep 2026
'Price is drawn to liquidation clusters': the sign flips
- Same direction across settings
- No
- Position snapshots
- 27.3 million
The few settings that worked disagree about which way price goes.
Read the autopsyclaim · method · every number · the raw chart
Source: Liquidation-map trading, widespread on YouTube and X
The 1% band says up. The 2% and 5% bands say down.
A real effect doesn't flip sign between neighbouring settings.
This verdict is about the strategy as published, not about the person who shared it.
The claim
Here’s what the strategy promises, in its own terms.
Big clusters of liquidation levels act like magnets; trade toward them.
How we tested it
Same six checks as everything else here: random entries, coin flips, a look-ahead audit, unseen years, double costs and a luck check. How we test →
What we found
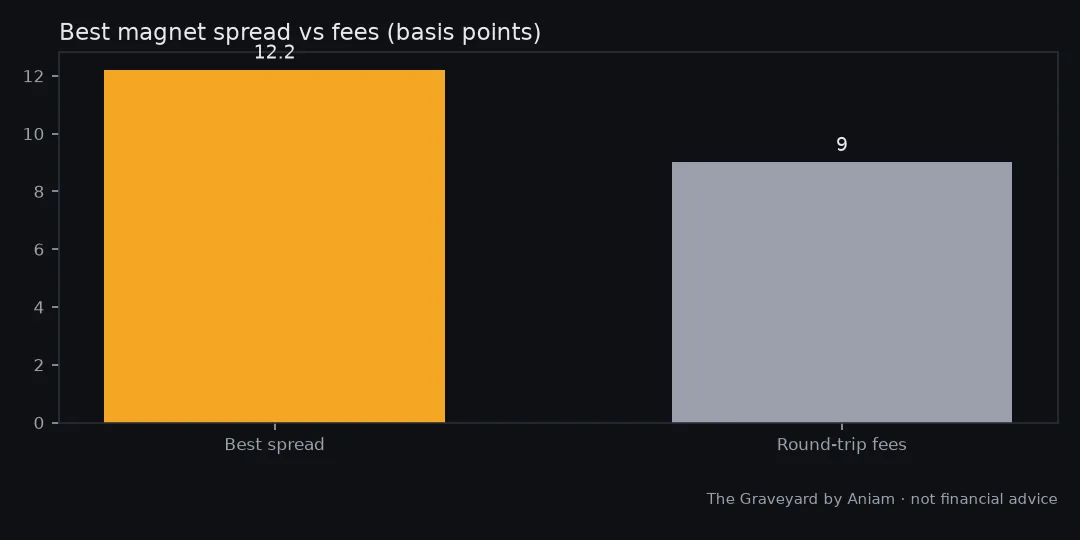
We recorded 27.3 million Hyperliquid position snapshots over 1,263 hours and tested 9 band-and-horizon combinations. Three beat their control, but with opposite signs: a 1% band said price goes up toward clusters below, the 2% and 5% bands said it goes down. A real effect does not flip sign between neighbouring settings. The best spread was 12 basis points against roughly 9 basis points of round-trip fees.
The numbers
The headline numbers from our test.
| Snapshots millions | 27.3 |
|---|---|
| Hours | 1,263 |
| Combos | 9 |
| Combos beating control | 3 |
| Sign consistent | no |
| Best spread | 12.2 bps |
| Fees | 9 bps |
- Profit factor: money won divided by money lost. Below 1.0 loses money. Around 1.0 is break-even.
- R-multiple: profit or loss measured in units of the amount risked per trade. +1R means you made what you risked.
- vs random: how the strategy did against the same trades with random entries.
You’re on the list.
Your first issue arrives with the next weekly send. Until then, the graveyard is open.