Nº 10 · 9 Oct 2026
KDJ on Nasdaq: profitable, mostly because Nasdaq went up
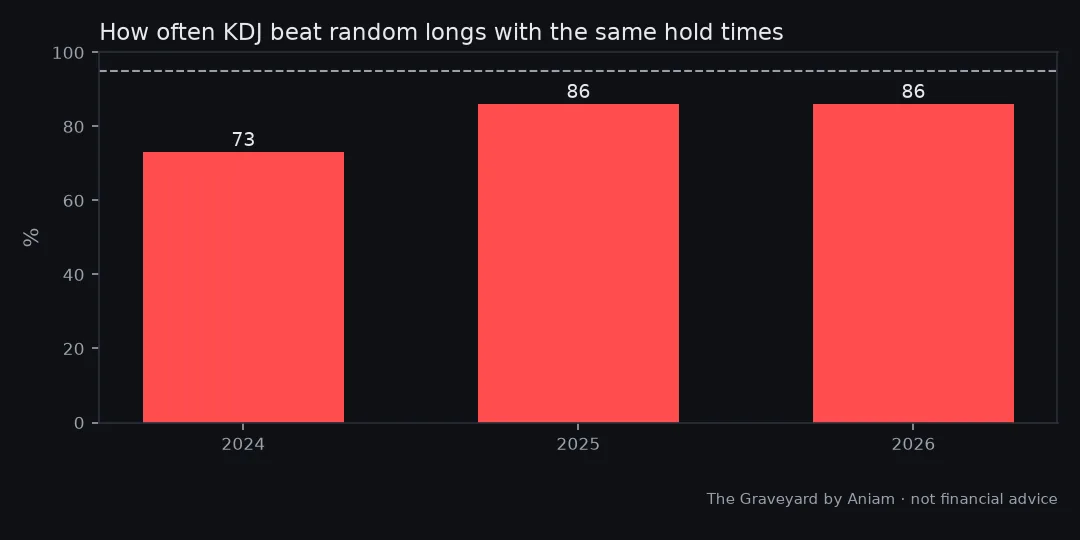
- Runs that beat random longs
- 73 / 86 / 86% (bar: 95%)
- Random long entries, profit factor
- ~1.2
- Stop
- None in the original
A lot of the profit is just Nasdaq going up, and it doesn't clear the bar against random longs.
Read the autopsyclaim · method · every number · the raw chart
Source: Common TradingView indicator strategy
Random long entries get ~1.2 on their own. Much of the profit is just Nasdaq going up.
Not dead, not proven.
This verdict is about the strategy as published, not about the person who shared it.
The claim
Here’s what the strategy promises, in its own terms.
Buy Nasdaq when the KDJ J-line turns up, sell when it rolls over.
How we tested it
Same six checks as everything else here: random entries, coin flips, a look-ahead audit, unseen years, double costs and a luck check. How we test →
What we found
Profit factor 1.66, 1.83 and 1.72 across 2024-2026, and a next-open fill does not hurt it. But random long entries with the same holding times score about 1.2 on their own, and KDJ beat those random longs in only 73%, 86% and 86% of 300 runs, below the 95% bar. It has no stop, so the losses hide as open drawdown. Not dead, not proven.
The numbers
The headline numbers from our test.
| PF by year | 1.66 / 1.83 / 1.72 |
|---|---|
| Random long PF | ~1.2 |
| Beats random longs | 73 / 86 / 86 (bar 95) |
| Stop | none in the original |
- Profit factor: money won divided by money lost. Below 1.0 loses money. Around 1.0 is break-even.
- R-multiple: profit or loss measured in units of the amount risked per trade. +1R means you made what you risked.
- vs random: how the strategy did against the same trades with random entries.
You’re on the list.
Your first issue arrives with the next weekly send. Until then, the graveyard is open.